
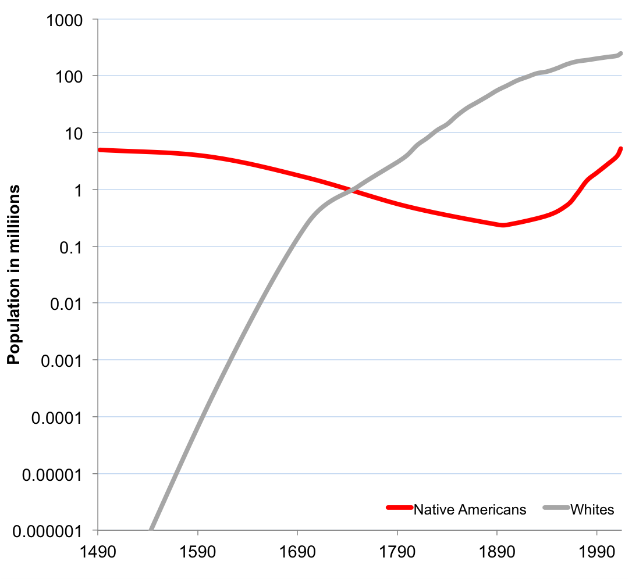
 Samuel W. Bennett’s GET DATA website features charts/graphs and infographics about current events, sports, news, culture, and history. We thought this log-scale graph of the native (in red, of course) and white population in the U.S. was fascinating, sad, and maybe, just maybe, encouraging.
His description:
After disease and war decimated the Native American population from an estimated pre-Columbian 5 million to a low of a few hundred thousand in the late 1800s, the American Native American population has recently approached the pre-Columbian population. The…figure shows that the population of American Native Americans from 1492 to present.
His chart that ranks Tolerance, Racism and Xenophobia in the United States shows we’re lots more tolerant than some other countries, but still have big-ass problems with gays, immigrants and “foreign languages,” not that this is news to us.
He writes:
The World Values Survey is an association of social scientists from around the world that gather data on human values, political and social life, as well as a host of other social statistics. Using the WVS data, I present here a brief analysis of tolerance, racism and xenophobia in the Western World, and show that when it comes to the above the, U.S. is ‘middle of the road’.
The below figure shows the number of respondents, by country that affirm the following positions. All questions began with, ‘Would not like to have as neighbors:’ and ends with the y-axis category. For example the first survey question was, ‘Would not like to have as neighbors: Different Race’ and 5.6% of American affirmed with this statement.

See more at GET DATA. Bennett is also on the Twitter.